September 10, 2026
Checked IELTS Essay
Topic
How does the internet harm us? How can it be put to good use?
Checked Version
The impact of internet [k4: wrong article] the internet is debated, especially regarding whether it is only harmful [k3: slightly unnatural / too absolute phrasing] more harmful than beneficial. In my opinion [k5: syntax — comma needed after an introductory phrase], the internet has a lot of [k1: style/register — too informal for an IELTS essay] many negative consequences.
For example, health problems (mental and physical), also less productivity and addition. [k5: syntax — sentence fragment + k3: list structure is unnatural + k5: wrong spelling] For example, it can cause both mental and physical health problems, reduce productivity and lead to addiction.
But it is important to understand that nowadays people have a lot of [k1: style/register — too informal for an IELTS essay] many opportunities because of the internet. This essay examines both perspectives and concludes that everything has two sides [k3: vague / cliché-like wording] the internet can be either harmful or useful depending on how it is used.
The internet can create serious problems, but it can also be a valuable tool when people use it responsibly.
To start with, I would like to delve into the problems of the online world. As I said later [k3: inaccurate word choice — you mean something mentioned before, not after] mentioned earlier, the Net users have dependent relationships [k3: unnatural collocation + unclear meaning] many internet users develop a form of dependency.
To give a clear example, I know a lot of people who can’t [k1: no short forms in formal writing] cannot even eat without a telephone [k3: inaccurate word choice — in this context, “phone” or “mobile phone” is more natural] mobile phone; they go to sleep with it and even to the bathroom [k3: incomplete / unnatural phrasing] take it to the bathroom.
In my opinion, it is really hard to communicate with those people [k3: repetition — “people” was used in the previous sentence] individuals, as they can’t [k1: no short forms in formal writing] cannot have a conversation without checking their phones.
Furthermore, internet [k4: wrong article] the internet causes stress, anxiety and makes it harder to concentrate. Ordinary work becomes unbearable without gadgets, so it really interfere [k4: wrong subject-word agreement] interferes with studies.
Excessive internet use can also increase stress and anxiety, shorten people’s attention span and make studying without digital devices much more difficult.
Despite all the drawbacks, I think that adequate use of technologies [k3: inaccurate word choice — you are discussing internet use in general, not different technologies] technology is necessary, as everything is connected with the internet and it streamlines everyday tasks.
From my perspective, it is really effective to communicate with people by telephone [k3: outdated / inaccurate phrasing in this context] online. For instance, a person can be in the emergency situation [k4: wrong article + k3: unnatural collocation] an emergency or can leave [k3: inaccurate word choice] live far away from his relatives [k3: gender-specific wording where a neutral form is better] their family, so it is very convenient to keep in touch because it bridges geographical distances.
Moreover, a lot of [k1: style/register — too informal for an IELTS essay] many people earn money thanks to the online world. These days [k5: syntax — comma needed after an introductory phrase], we have many delivery companies, online schools, sport apps [k3: inaccurate word choice] fitness apps and a bunch of other stuff [k1: style/register — too informal for an IELTS essay] many other online services.
It is unreal to list all the power people can have. [k3: unclear phrasing + k2: weak development — the idea needs to be expressed more precisely] It is almost impossible to list all the opportunities that the internet creates.
The internet can be put to good use by improving communication, supporting online education, creating jobs and making everyday services faster and more accessible.
In conclusion, I can say that the most important thing is to be aware that the cyberspace [k3: inaccurate / slightly unnatural word choice here] the internet can be used in a lot of [k1: style/register — too informal for an IELTS essay] many ways and it is crucial to use it properly and reduce our attention to spam [k3: unnatural collocation + unclear meaning] limit our exposure to distractions and harmful content.
To avoid wrong sides [k3: inaccurate word choice] negative effects, it may be useful to do strict restrictions [k3: unnatural collocation] set strict limits on screen time.
But it’s all individual. [k1: no short forms in formal writing + k2: abrupt / weak final sentence] However, the best solution may depend on each person’s habits and needs.
Overall, the internet should not be avoided completely, but people need to use it consciously and control the amount of time they spend online.
Corrected Version
The impact of the internet is debated, especially regarding whether it is more harmful than beneficial. In my opinion, the internet has many negative consequences. For example, it can cause both mental and physical health problems, reduce productivity and lead to addiction. However, it is important to understand that nowadays people also have many opportunities because of the internet. This essay examines both perspectives and concludes that the internet can be either harmful or useful depending on how it is used.
To start with, I would like to delve into the problems of the online world. As I mentioned earlier, many internet users develop a form of dependency. To give a clear example, I know many people who cannot even eat without a mobile phone; they go to sleep with it and even take it to the bathroom. In my opinion, it is hard to communicate with these individuals, as they cannot have a conversation without checking their phones. Furthermore, the internet causes stress and anxiety and makes it harder to concentrate. Ordinary work becomes unbearable without gadgets, so it interferes with studies.
Despite all the drawbacks, I think that adequate use of technology is necessary, as everything is connected with the internet and it streamlines everyday tasks. From my perspective, it is effective to communicate with people online. For instance, a person can be in an emergency or live far away from their family, so it is very convenient to keep in touch because the internet bridges geographical distances. Moreover, many people earn money thanks to the online world. These days, there are many delivery companies, online schools, fitness apps and other online services. It is almost impossible to list all the opportunities that the internet creates.
In conclusion, the most important thing is to be aware that the internet can be used in many ways. It is crucial to use it properly and limit our exposure to distractions and harmful content. To avoid negative effects, it may be useful to set strict limits on screen time. However, the best solution may depend on each person’s habits and needs.
Alternative Higher-Scoring Version
The impact of the internet is often debated, especially because it can both harm people and improve their lives. In my opinion, the internet creates serious risks, such as addiction, anxiety and lower productivity. However, it can also be put to good use if people use it for communication, education and work rather than constant entertainment.
One major problem is that many users become dependent on digital devices. Some people cannot eat, study or talk to others without checking their phones. This habit can damage real-life communication and make it harder to focus for a long time. Excessive internet use may also increase stress and anxiety, especially when people are constantly exposed to notifications, negative news or social media comparisons. As a result, studying and working without gadgets may become much more difficult.
Nevertheless, the internet can be extremely useful when it is used wisely. It helps people keep in touch with relatives who live far away and can be especially important in emergencies. It also supports education, as students can attend online lessons, use digital libraries and learn from teachers in other countries. In addition, the internet creates many job opportunities through online schools, delivery services, remote work and digital businesses.
In conclusion, the internet is neither purely harmful nor purely beneficial. It can damage people’s health and concentration if they use it excessively, but it can also make communication, education and work more convenient. Therefore, the key is to use it consciously and set reasonable limits on screen time.
Score
| Criterion | Estimated Band | Feedback |
|---|---|---|
| Task Response | 6.0 | You answer both parts of the task: how the internet harms us and how it can be useful. You give relevant examples, such as addiction, stress, communication and online work. However, some ideas are too general, and the conclusion is weak because “But it is all individual” does not clearly summarise your position. |
| Coherence and Cohesion | 5.5 | You organise the essay into an introduction, two body paragraphs and a conclusion. However, the logic is sometimes loose. For example, the paragraph about benefits moves from emergencies to relatives, then to online business very quickly. You need smoother linking and clearer progression from idea to explanation to example. |
| Lexical Resource | 5.5 | You use some good phrases, such as “streamlines everyday tasks” and “bridges geographical distances”. However, there are many unnatural or informal expressions: “a bunch of other stuff”, “wrong sides”, “do strict restrictions”, “dependent relationships”, and “all the power people can have”. |
| Grammar Range and Accuracy | 5.5 | You use some complex sentences, but grammar problems are still noticeable: missing articles, subject-verb agreement, sentence fragments and incorrect structures. The meaning is usually clear, but accuracy needs improvement. |
| Overall Estimated Band | 5.5–6.0 | A realistic estimate is around Band 6.0 if the examiner focuses on task coverage, but Band 5.5 is also possible because of frequent unnatural phrasing and grammar problems. |
Feedback for You
You have a clear position and you do answer both questions in the task. You explain that the internet can harm people through addiction, stress and lower productivity, but you also show that it can be useful for communication, work and online services.
Your main problem is not the choice of ideas, but the way they are expressed. Some phrases sound too spoken or vague for an IELTS essay, for example “a bunch of other stuff”, “wrong sides”, “it is unreal to list” and “everything has two sides”. Try to replace these with more precise academic wording.
You should also avoid contractions in formal writing. Use cannot instead of can’t and it is instead of it’s.
To improve the essay, make each paragraph follow a clearer structure: main idea → explanation → example → result. This will make your argument more convincing and easier to follow.
Main Rephrases
- the impact of internet → the impact of the internet
- only harmful → more harmful than beneficial
- a lot of negative consequences → many negative consequences
- addition → addiction
- dependent relationships → a form of dependency
- telephone → mobile phone
- it really interfere studies → it interferes with studies
- by telephone → online
- in the emergency situation → in an emergency
- sport apps → fitness apps
- a bunch of other stuff → many other online services
- wrong sides → negative effects
- do strict restrictions → set strict limits on screen time
Potentially Missed or Debatable Issues
The phrase “the Net” is understandable, but it sounds slightly old-fashioned in an IELTS essay. “The internet” is safer and more neutral.
“I would like to delve into” is not wrong, but it may sound slightly overformal compared with the rest of the essay. A simpler phrase such as “One major problem is...” would sound more natural.
The idea about spam appears only in the conclusion and is not developed in the body paragraphs. If you mention spam in the conclusion, you should also discuss distractions, harmful content or misinformation earlier in the essay.
The essay mixes formal and informal style. This is why phrases such as “delve into” and “a bunch of other stuff” feel inconsistent when they appear in the same text.
Checked IELTS Writing Task 1 Report
Task
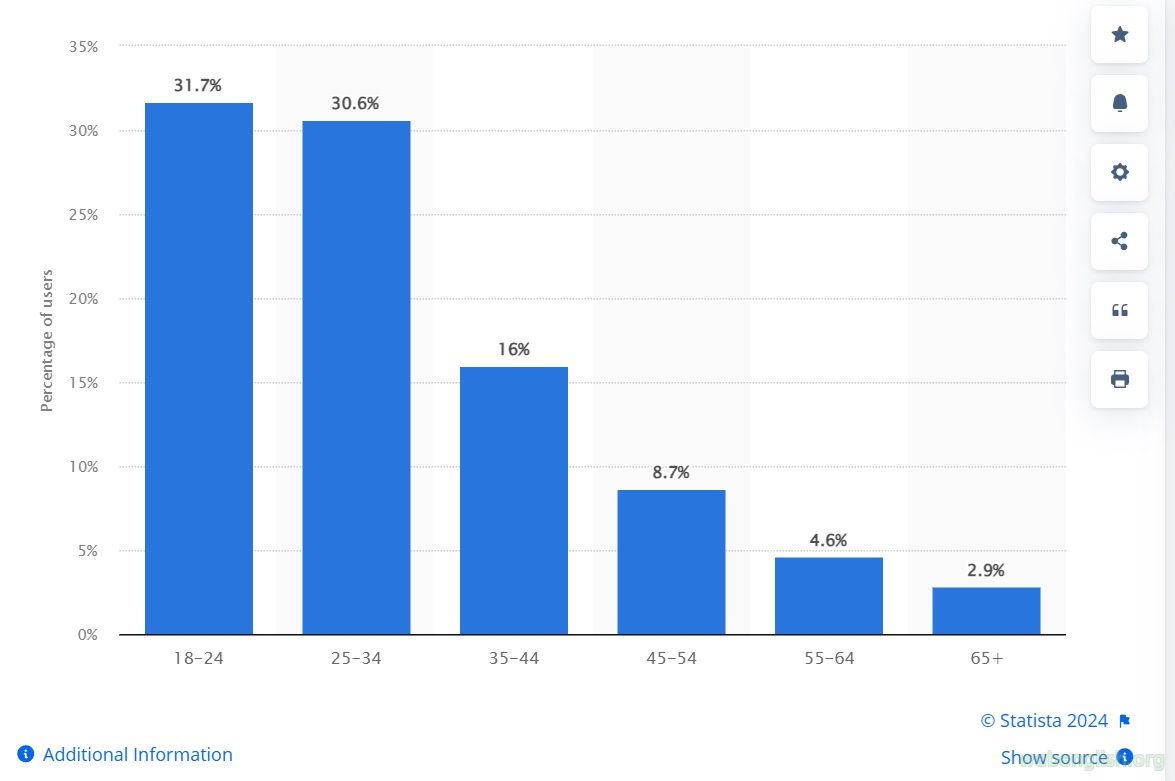
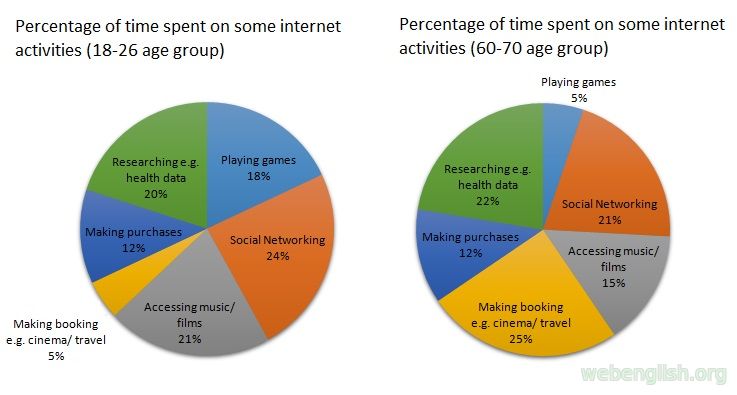
The bar chart shows the distribution of a social network's users worldwide as of April 2024, by age group. The pie charts illustrate the most popular activities of social network users of two age groups.
Checked Version
The two pie charts compare the percentage of time spent on various internet activities by two different age groups, while the bar chart shows the percentage of social network users worldwide as of April 2024, by age group. Overall, it is clearly evident [k3: redundancy — “clearly” and “evident” repeat the same idea] evident that people aged 18–24 spend the most time online [k0: task achievement — the bar chart shows the largest share of users, not the amount of time spent online] make up the largest share of users, with social networking being their most preferred activity, whereas those aged 60–70 prefer making bookings, such as for cinema tickets or travel.
Overall, the youngest age group forms the largest share of users, while the two pie charts show that social networking is the leading activity among 18–26-year-olds and making bookings is the leading activity among 60–70-year-olds.
As I mentioned before [k2: incorrect linking — nothing has been “mentioned before” in the body paragraph; this is the first detailed description] can be seen from the bar chart, the social networks are used mostly by people aged 18-24 with 31.7% [k3: unnatural phrasing + k0: data description — the chart shows the distribution of users, not exactly how much each group uses social networks] 18–24-year-olds account for the largest share of users, at 31.7%.
A few percentage points lower (30.6%) are people aged 25-34. [k4: incorrect word order + k3: unnatural phrasing] The 25–34 age group follows closely, at 30.6%.
People aged 35–44 use it significantly less [k0: inaccurate data description — the chart shows their share among users, not their individual frequency of use] represent a much smaller share (16%), followed by people in the age range of 25 to 54 [k0: wrong data reference — the correct age group is 45–54] 45 to 54 at 8.7%.
People in age bracket [k4: wrong article] the age bracket of 55 to 64 account for 4% less [k0: inaccurate data description — the chart gives 4.6%, not “4% less”] 4.6%, and people aged 65 and more [k3: unnatural phrasing] and over account for 2.9%.
The share then falls sharply with age: 35–44-year-olds make up 16%, while the figures for the 45–54, 55–64 and 65+ groups are 8.7%, 4.6% and 2.9% respectively.
Comparing two pie charts [k4: wrong article] the two pie charts, it is noticeable that both age groups use social networks a lot [k1: register — too informal for IELTS Task 1] extensively (24% and 21%); however, for the older group this is not the most preferred [k3: incomplete phrasing] popular activity, as making bookings for cinema or travel accounts for a higher proportion at 25%.
Researching health data stands at 22% among people aged 60–70 and 20% among people aged 18–26.
Also, people 18-26 year olds are into music and films with 21% [k1: register — too informal + k4: incorrect noun phrase + k3: unnatural data description] 18–26-year-olds spend 21% of their time on accessing music and films, while for older people it is lower by 6% [k3: data expression — use “percentage points” when comparing two percentages] 6 percentage points.
Not surprisingly, playing games accounts for 18% in younger age group [k4: wrong article] the younger age group, when [k4: incorrect conjunction] whereas 60–70-year-olds use it [k3: inaccurate wording — the chart shows time spent on the activity] spend considerably less time on this activity (5%).
Making purchases is the same for both groups, with [k3: unnatural data phrasing] at 12%.
The most unpopular activity among 18-26 year old people [k4: incorrect compound adjective / noun phrase] 18–26-year-olds is making bookings(5%) [k5: syntax — space needed before brackets] (5%).
Among younger users, social networking is the largest category, at 24%, followed by accessing music and films at 21% and researching health data at 20%. By contrast, older users spend the largest proportion of their time on bookings, at 25%, while playing games is much less common, at only 5%.
Finally, it is evident that two age groups [k4: wrong article] the two age groups have some common interest [k4: incorrect number form] interests (social networking, making purchases and researching health data) and absolutely different ones [k1: register — too informal / too strong + k3: unnatural phrasing] clear differences, such as playing games and making bookings.
Overall, the two groups share some similar habits, especially in social networking, online shopping and health research, but they differ sharply in gaming and booking-related activities.
Corrected Version
The two pie charts compare the percentage of time spent on various internet activities by two different age groups, while the bar chart shows the distribution of a social network’s users worldwide as of April 2024. Overall, the youngest age group forms the largest share of users, while the two pie charts show that social networking is the leading activity among 18–26-year-olds and making bookings is the leading activity among 60–70-year-olds.
As can be seen from the bar chart, 18–24-year-olds account for the largest share of users, at 31.7%. The 25–34 age group follows closely, at 30.6%. The share then falls sharply with age: 35–44-year-olds make up 16%, while the figures for the 45–54, 55–64 and 65+ groups are 8.7%, 4.6% and 2.9% respectively.
Comparing the two pie charts, it is noticeable that both age groups spend a considerable proportion of their time on social networking, at 24% for younger users and 21% for older users. However, among the 60–70 age group, making bookings for cinema or travel is the most popular activity, at 25%. Researching health data is also common in both groups, accounting for 22% among older users and 20% among younger ones.
Among younger users, accessing music and films accounts for 21%, compared with 15% among older users. Playing games shows the largest difference: it represents 18% of the younger group’s time but only 5% of the older group’s. Making purchases is identical in both groups, at 12%, while the least common activity among 18–26-year-olds is making bookings, at 5%.
Alternative Higher-Scoring Version
The bar chart shows the age distribution of a social network’s users worldwide in April 2024, while the pie charts compare how users aged 18–26 and 60–70 distribute their time across several online activities.
Overall, the user base is dominated by people under 35, especially those aged 18–24 and 25–34. In terms of activities, younger users spend the largest share of their time on social networking, whereas older users devote the greatest proportion to making bookings. Gaming is far more popular among the younger group, while online purchases take the same share in both age groups.
Looking first at the bar chart, 18–24-year-olds account for the largest proportion of users, at 31.7%, closely followed by the 25–34 group at 30.6%. After this, the figures decline considerably: the share falls to 16% for those aged 35–44 and to 8.7% for the 45–54 age group. The two oldest categories make up much smaller proportions, with 55–64-year-olds at 4.6% and users aged 65 and over at only 2.9%.
The pie charts show several similarities and differences. Social networking is the top activity among 18–26-year-olds, at 24%, compared with 21% among those aged 60–70. The older group spends slightly more time researching health data, at 22% versus 20%. Making purchases is identical in both groups, at 12%. However, there are clear contrasts in gaming and bookings: playing games accounts for 18% among younger users but only 5% among older ones, while bookings represent just 5% in the younger group but 25% among older users.
Score
| Criterion | Estimated Band | Feedback |
|---|---|---|
| Task Achievement | 6.0 | You describe both the bar chart and the pie charts, include an overview, and use most of the key figures. However, there are some data-description problems. The most important one is saying that 18–24-year-olds “spend the most time online”; the bar chart only shows that they make up the largest share of users. You also misread the 45–54 group as “25 to 54” and describe 4.6% as “4% less”. |
| Coherence and Cohesion | 6.0 | You organise the report logically: introduction, overview, bar chart, pie charts and final comparison. However, some linking is not natural. “As I mentioned before” is unsuitable in a chart report, and the final paragraph partly repeats the overview instead of adding a sharper summary. |
| Lexical Resource | 5.5 | You use some good vocabulary, such as “percentage points”, “accounts for”, “proportion” and “preferred activity”. However, several phrases are inaccurate or informal: “use it significantly less”, “are into music and films”, “absolutely different ones” and “used mostly by people”. |
| Grammar Range and Accuracy | 5.5 | You use a range of sentence structures, but there are repeated problems with articles, noun phrases and comparison structures: “Comparing two pie charts”, “in younger age group”, “18–26 year old people”, and “A few percentage points lower are people aged 25–34”. |
| Overall Estimated Band | 6.0 | This is around Band 6.0 because the report is relevant, organised and data-rich, but accuracy problems in both language and data description prevent it from going higher. |
Feedback for You
You understood the charts quite well and included many important numbers. Your structure is also suitable for IELTS Task 1: you introduce the visuals, give an overview, describe the bar chart, and then compare the pie charts.
Your main problem is data description. In Task 1, you must be very careful not to say more than the chart actually shows. For example, the bar chart does not show who spends the most time online; it only shows the percentage distribution of users by age group. So you should write “18–24-year-olds make up the largest share of users”, not “spend the most time online”.
You also need to make your comparisons more precise. When comparing percentages, use percentage points, not just percent. For example, 21% and 15% differ by 6 percentage points.
Your vocabulary is sometimes too conversational for IELTS Writing Task 1. Replace phrases like “are into music and films” and “absolutely different ones” with more neutral chart-report language, such as “spend time on accessing music and films” and “show clear differences”.
Main Rephrases
- spend the most time online → make up the largest share of users
- As I mentioned before → As can be seen from the bar chart
- the social networks are used mostly by people aged 18–24 with 31.7% → 18–24-year-olds account for the largest share of users, at 31.7%
- A few percentage points lower are people aged 25–34 → The 25–34 age group follows closely
- use it significantly less → represent a much smaller share
- 4% less → 4.6%
- people 18–26 year olds are into music and films with 21% → 18–26-year-olds spend 21% of their time on accessing music and films
- lower by 6% → lower by 6 percentage points
- absolutely different ones → clear differences
Potentially Missed or Debatable Issues
“Most preferred activity” is understandable, but “most popular activity” is more natural in chart description.
“Finally” is not wrong, but IELTS Task 1 reports usually do not need a separate conclusion after the data paragraphs. A strong overview near the beginning is usually enough.
The phrase “the percentage of time spent” is correct for the pie charts, but it should not be transferred to the bar chart, which describes the percentage of users, not time.
September 26, 2026
Checked IELTS Writing Task 1 Report
Task
The chart shows the most desired Christmas gifts among UK respondents, divided by gender.
Checked Version
The bar chart below shows the most desired gift ideas [k3: inaccurate word choice — the chart shows categories/types of gifts, not “ideas”] Christmas gifts between males and females [k3: unnatural phrasing — use “among men and women” when comparing groups] among men and women.
Overall, it is clear that the most successful [k3: inaccurate word choice — a gift is not “successful” in this context] popular gift for the men [k4: wrong article] men would be money and for the women [k4: wrong article] women beauty products [k3: less precise than the chart label] cosmetics, perfume and body care products.
Overall, money was the most desired gift among men, while cosmetics, perfume and body care products ranked first among women.
So [k1: register — too informal for IELTS Writing Task 1] When comparing the two sexes [k5: syntax — comma needed after an introductory clause], we can see that the least attractive present for the men [k4: wrong article] men is a computer [k3: inaccurate wording — the chart refers to computers and computer accessories] computers and computer accessories at 22% and tickets for the event [k3: unnatural phrasing] event tickets for women at 28%.
While it is obvious [k1: register — too subjective / judgemental for a chart report] notable that men don’t like cosmetics [k0: inaccurate interpretation + k1: no short forms in formal writing!!! — 23% is not enough to say that men do not like this category] were much less interested in cosmetics, perfume and body care products (23%), women are really into this category [k1: register — too informal for IELTS Writing Task 1] far more interested in this category, with 55% choosing it.
Surprisingly, electronic devices [k3: inaccurate / too broad wording — the chart lists smartphones, tablets and accessories] smartphones, tablets and accessories and jewellery with watches [k3: unnatural phrasing] jewellery and watches are not the best gift idea [k4: incorrect number form] gift choices for men (24%) and women (36%).
[k2: weak logic — this sentence compares two different categories from two different gender lists, so the comparison is not very meaningful]
Ebooks [k3: inaccurate wording — the chart says “Books, eBooks”] Books and eBooks are equal to smartphones for men with [k3: unnatural data phrasing] at 24%, while food and drinks are higher than jewellery and watches [k2: unclear comparison — specify that this refers to women] among women (41%).
In fourth place [k5: syntax — comma needed after an introductory phrase], men have food and drinks (31%) and women have vouchers and gift cards (45%).
Moreover, clothing, textiles and shoes are also at 45% among women, whereas this category is on the second place [k3: unnatural phrase] in second place among men (36%).
On the third place men have vouchers and gift cards account for 33%. [k4: incorrect structure + k3: unnatural data description] Vouchers and gift cards are in third place among men, at 33%.
And the most wanted present for male is money. [k1: register — avoid starting a sentence with “And” in formal Task 1 + k4: incorrect number form] The most wanted present among men is money, at 40%.
Among men, money ranked first at 40%, followed by clothing, textiles and shoes at 36% and vouchers or gift cards at 33%. Among women, cosmetics, perfume and body care products were the leading category, at 55%, followed by money at 48%, while clothing and vouchers were both chosen by 45%.
In conclusion, male and female recipients [k3: slightly unnatural / overly technical phrasing] men and women have different preferences for presents, but for both sexes money and clothing are attractive.
Overall, men and women showed different preferences, although money and clothing were popular choices for both groups.
Data Illustration / What You Should Notice
| Category | Men | Women | Useful comparison |
|---|---|---|---|
| Money | 40% | 48% | Popular with both groups; first for men, second for women. |
| Clothing, textiles, shoes | 36% | 45% | Women chose this 9 percentage points more often. |
| Vouchers / gift cards | 33% | 45% | This category was also much more popular among women. |
| Food, drinks | 31% | 41% | Women were 10 percentage points more likely to choose this option. |
| Cosmetics, perfume, body care | 23% | 55% | This was the biggest gender gap: 32 percentage points. |
| Books, eBooks | 24% | 32% | This was moderately more popular among women. |
| Tech-related gifts | 24% | Not shown | Smartphones, tablets and accessories appear only in the men’s list. |
| Jewellery and watches | Not shown | 36% | This appears only in the women’s list. |
Corrected Version
The chart compares the Christmas gifts that male and female UK respondents would be happy to receive. Overall, money was the most desired gift among men, while cosmetics, perfume and body care products ranked first among women. It is also clear that money and clothing were popular with both groups.
Among men, money was the leading option, chosen by 40% of respondents. Clothing, textiles and shoes came second, at 36%, followed by vouchers or gift cards at 33%. Food and drinks were also relatively popular, at 31%. By contrast, books and eBooks, and smartphones, tablets and accessories were both chosen by 24% of male respondents, while cosmetics, perfume and body care products stood at 23%. The least popular male category was computers and computer accessories, at 22%.
Among women, cosmetics, perfume and body care products were by far the most popular choice, at 55%. Money ranked second, at 48%, while clothing, textiles and shoes, and vouchers or gift cards were equal at 45%. Food and drinks accounted for 41%, followed by jewellery and watches at 36% and books and eBooks at 32%. Event tickets were the least desired option among women, at 28%.
Overall, the largest difference between the two groups was in cosmetics and body care, which were much more popular among women. However, both men and women showed strong interest in practical gifts such as money, clothing and vouchers.
Alternative Higher-Scoring Version
The bar chart compares the Christmas gifts that male and female UK respondents said they would be happy to receive in 2022. Respondents could choose more than one option.
Overall, money was the most popular gift among men, whereas women showed the strongest preference for cosmetics, perfume and body care products. Practical gifts, especially money, clothing and vouchers, were popular with both genders, although women generally recorded higher percentages in most shared categories.
Looking first at male respondents, 40% said they would like to receive money, making it the top choice. Clothing, textiles and shoes came next at 36%, followed by vouchers or gift cards at 33% and food and drinks at 31%. The remaining categories were less popular: books and eBooks and smartphones, tablets and accessories each accounted for 24%, while cosmetics stood at 23%. Computers and computer accessories were the least desired male gift category, at 22%.
For women, cosmetics, perfume and body care products were the clear leader, at 55%. Money was also highly popular, at 48%, while clothing and vouchers were level at 45%. Food and drinks attracted 41% of female respondents, compared with 36% for jewellery and watches and 32% for books and eBooks. Event tickets were the least common choice among women, although the figure was still relatively high at 28%.
The most striking gender difference was in cosmetics and body care, with a gap of 32 percentage points. However, the two groups were similar in their interest in money, clothing and vouchers, which all appeared among the top choices for both men and women.
Score
| Criterion | Estimated Band | Feedback |
|---|---|---|
| Task Achievement | 6.0 | You describe the main data and include an overview. You correctly identify the top categories for men and women. However, some comparisons are unclear or not fully accurate. For example, saying that men “do not like cosmetics” is too strong because 23% still chose this category. You should focus more on the biggest trends and differences instead of listing points in a mixed order. |
| Coherence and Cohesion | 5.5 | Your report has an introduction, overview, body paragraph and conclusion, but the organisation is not ideal. You start with the least popular categories, then move to cosmetics, electronics, books, food, clothing and money. This makes the description harder to follow. A clearer structure would be: men’s top choices, women’s top choices, then key similarities and differences. |
| Lexical Resource | 5.5 | You use some useful chart vocabulary, such as “at 22%”, “category” and “accounts for”. However, several phrases are too informal or inaccurate for IELTS Task 1, including “are really into this category”, “the best gift idea”, “the most wanted present for male” and “tickets for the event”. |
| Grammar Range and Accuracy | 5.5 | You use some comparative structures, but there are repeated problems with articles, noun phrases and sentence structure: “the men”, “on the second place”, “on the third place men have vouchers and gift cards account for 33%”, and “for male”. These mistakes do not usually block meaning, but they reduce accuracy. |
| Overall Estimated Band | 5.5–6.0 | The response is relevant and includes many figures, so it is close to Band 6. However, the organisation, informal wording and some inaccurate interpretations keep it around 5.5–6.0. |
Feedback for You
You understood the chart and included many important figures. Your overview is also clear: you correctly noticed that money was the top choice for men and beauty-related products were the top choice for women.
Your main problem is organisation. In IELTS Writing Task 1, it is usually better not to list the data randomly. Start with the most important trends: the top gifts for men, the top gifts for women, and the biggest similarities or differences. This will make your report much easier to follow.
You also need to avoid informal language. Phrases like “women are really into this category” sound natural in conversation, but they are not suitable for a formal chart report. Use neutral language such as “this category was far more popular among women”.
Be careful not to overinterpret the data. If 23% of men chose cosmetics, you should not write that men “do not like cosmetics”. It is safer to say that this category was less popular among men than among women.
Main Rephrases
- gift ideas → Christmas gifts / gift categories
- between males and females → among men and women
- the most successful gift → the most popular gift
- for the men / for the women → for men / for women
- tickets for the event → event tickets
- men don’t like cosmetics → cosmetics were much less popular among men
- women are really into this category → this category was far more popular among women
- on the second place → in second place
- on the third place men have vouchers and gift cards account for 33% → vouchers and gift cards are in third place among men, at 33%
- the most wanted present for male → the most wanted present among men
Potentially Missed or Debatable Issues
The word “sexes” is not grammatically wrong, but in this type of chart report, “men and women” or “male and female respondents” sounds more natural.
The phrase “beauty products” is understandable, but the chart gives a more precise label: “cosmetics, perfume and body care”. In Task 1, it is usually better to stay close to the chart wording.
The chart note says that respondents could choose multiple options. This means the percentages do not add up to 100%, so you should avoid wording that suggests a strict distribution of one choice per person.
The final sentence is relevant, but IELTS Task 1 does not require a personal-style conclusion. A clear overview and data summary are more important.